With different styles and customization options, you can create a useful pie chart in Excel and an attractive one simultaneously.
How to Create a Pie Chart in Excel
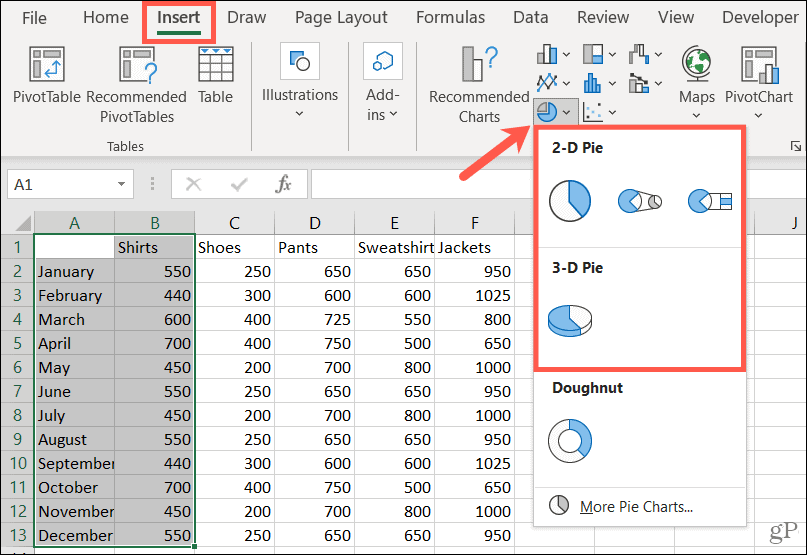
While some of the features for customizing a pie chart differ slightly, the process for creating one is the same in Excel on Windows, Mac, and the web.
You’ll see that pie chart pop right into your spreadsheet, ready for you to customize!
Customize a Pie Chart in Excel
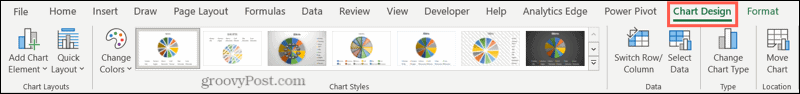
Once you insert your pie chart, select it to display the Chart Design tab. These tools give you everything you need to customize your chart fully. You can add a chart element like a legend or labels, adjust the layout, change the colors, pick a new style, switch columns and rows, update the data set, change the chart type, or move the chart.
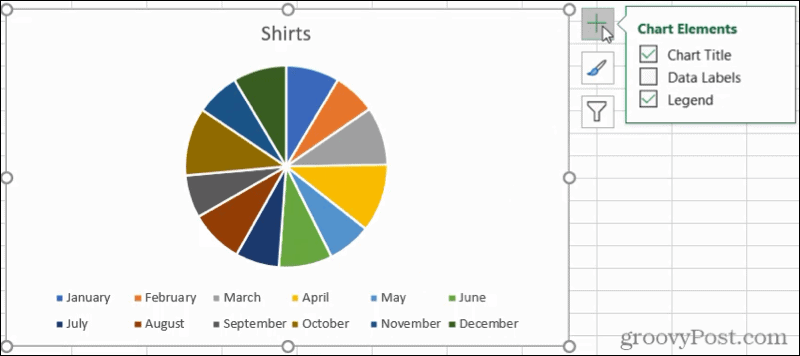
Excel on Windows offers an extra feature for customizing your chart. Select the chart, and you’ll see three buttons appear on the right side for Chart Elements, Chart Styles, and Chart Filters. The first two buttons correspond to the same buttons in the ribbon. So you can use Chart Elements to add more items or choose their positions on the chart.
With Chart Styles, you can pick from various color schemes and styles in one handy spot.
If you want to select different parts of your data for the chart, use the Chart Filters. Plus, you can hover your cursor over a category to highlight that piece of the pie.
Resize and Move a Chart
If you’ve worked with other types of charts in Excel, then you’ll be glad to know it’s just as easy to resize or move a pie chart. To resize a pie chart, drag in or out from one of the corners or edges.
To move a pie chart, select it and use the four-sided arrow to drag it to its new spot on your sheet.
Customize Your Pie Chart and Display Your Data
Pie charts are terrific tools for displaying your data. They allow your audience to see data nicely, neatly, and at a glance. If you have an older version, such as Excel 2007 or Excel 2010, check out how to create a pie chart in those versions. And for other types of visuals, take a look at how to create a Gantt chart in Excel or make a scatter plot to present your data. Comment Name * Email *
Δ Save my name and email and send me emails as new comments are made to this post.


![]()
